Is Your ROAS Is Lying to You? — Here’s How to Read the Truth Before You Burn Good Campaigns
I've seen this movie too many times. Many startups kill campaigns too early. Learn how to use click-time and conversion-time attribution to see the real ROI behind your ad spend.
I’ve seen this movie too many times.
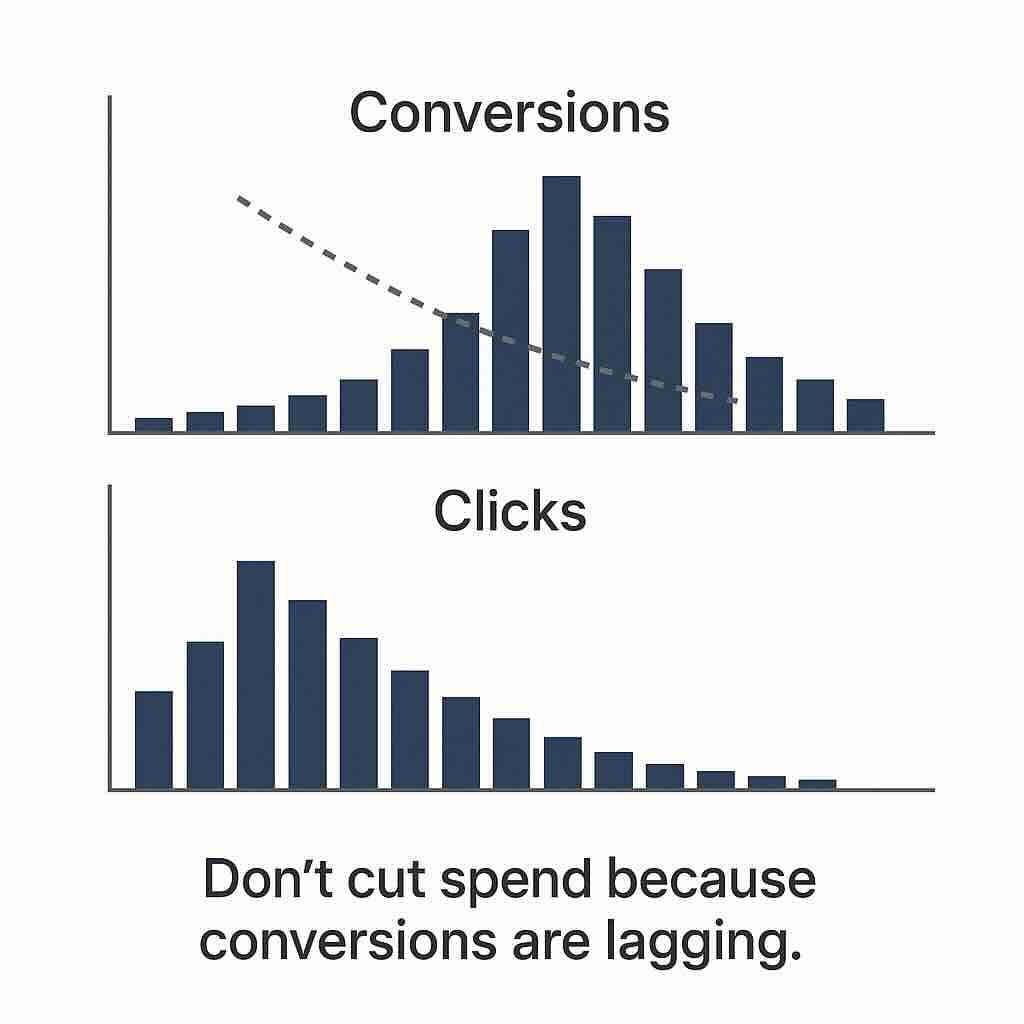
You’re running paid media for a startup. Pressure’s on. You need results—fast. So you launch, spend, and monitor performance like a hawk. A week in, conversions look flat. The campaign looks like a dud. You cut budget, shift strategy, start tweaking landing pages…
Then, weirdly, conversions spike after you’ve cut spend. The budget you killed suddenly looks like it was working. But now it’s too late—you already pivoted.
Sound familiar?
This happens because you’re looking at the wrong time window.
Most startups measure performance by conversion date. That’s when the lead or sale happens. Sounds logical—but it’s misleading.
Here’s the trap: there’s often a delay between click and conversion. Especially for higher-ticket items, B2B, or anything with sales cycles longer than “impulse buy.” That delay can range from hours to weeks.
So when you ramp up spend and expect an immediate return, you’re setting yourself up for disappointment. Worse—you’re making decisions based on data that isn’t done baking yet.
The Fix: Look at performance by when the click happened.
This is called click-time attribution. You map each conversion back to the moment the click occurred, not when the sale closed.
- It tells you which marketing dollars actually drove results.
- It reveals the true cost of customer acquisition in the moment.
- It prevents false spikes (or dips) caused by delayed conversions.
But click-time has a blind spot, too.
Click-time undercounts recent spend—because it doesn’t include the conversions that haven’t happened yet. So if you’re in a short reporting window, even click-time will look weak.
What I’ve learned after fixing this for multiple startups:
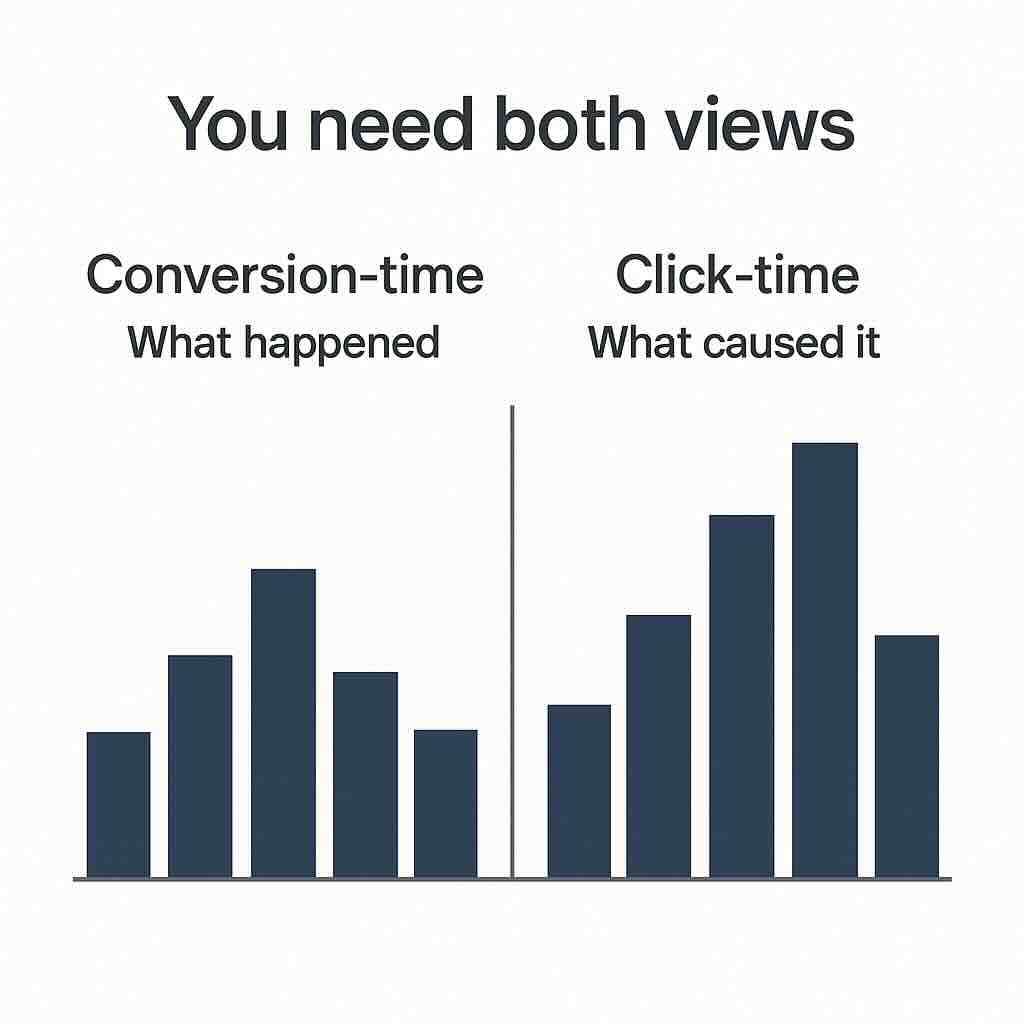
You need both views.
- Conversion-time shows results realized. It’s your scoreboard. What actually came through the door.
- Click-time shows cost and cause. It tells you what each dollar of spend truly delivered—if you wait long enough to measure all the conversions.
But waiting isn’t always an option in fast-paced teams. That’s why the best solution is this:
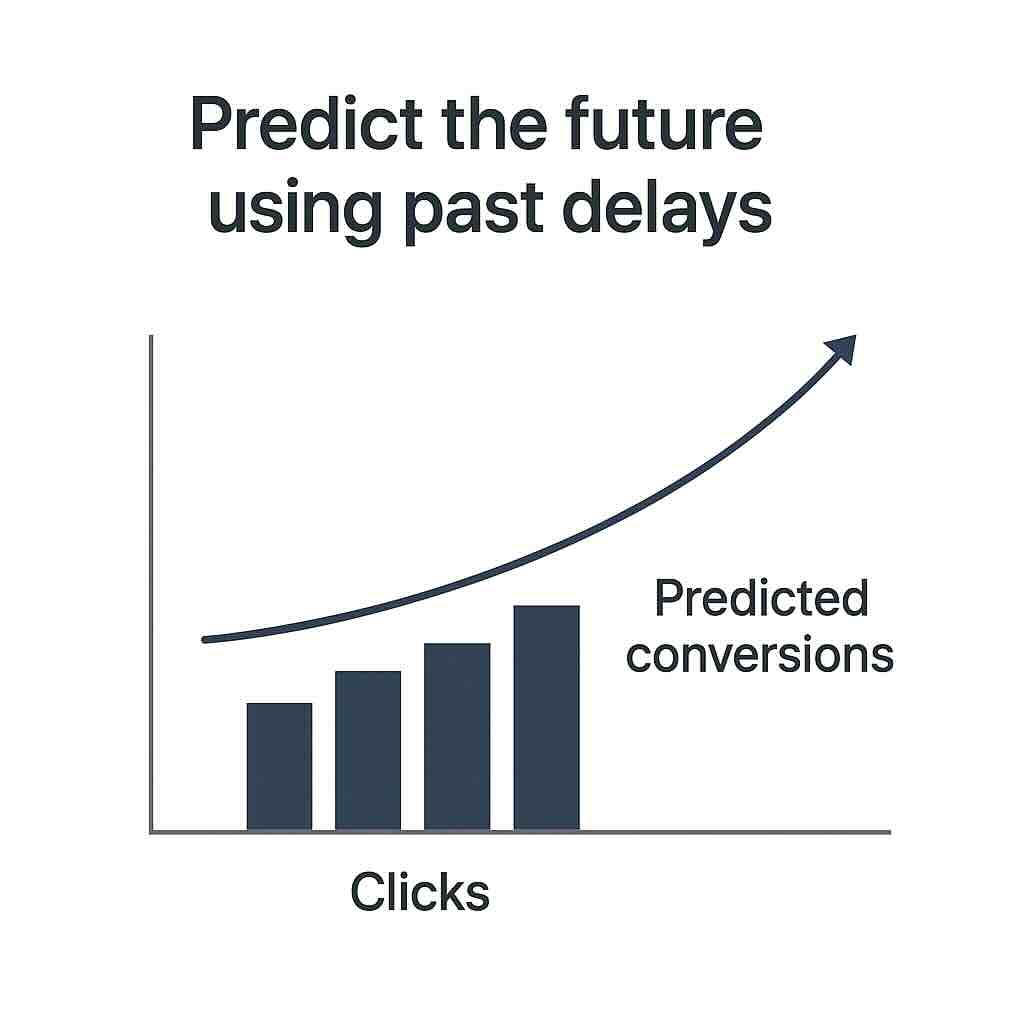
👉 Use a predictive multiplier.
Take historical data, analyze the average conversion lag, and apply a projection. Estimate how many future conversions current clicks are likely to drive.
(I’ll break down how to calculate that in a follow-up post.)
Bottom line: Don’t trust the default dashboards.
I’ve helped multiple startups stop this exact problem from sabotaging growth. The shift from “What’s converting now?” to “What will convert based on what we’ve already paid for?”—that’s where smarter decisions live.
You don’t need to spend more. You need to see more clearly.
Need help building better attribution and forecasting models?
I work with growth-stage startups to fix reporting blind spots, optimize ROAS, and unlock scale without wasting budget.
👉 Get in touch here to talk through what’s missing in your current setup. I’ll send you a short lead form to learn more about your goals.
![]()
Why Smart Startups Don’t Use Ad Platform Conversions for Reporting
The Data Looks Good—But It's Lying to You Most startup founders and marketing leads look at conversion numbers inside ad…
Reading Time: 3 min

Is Your Attribution Model Missing 50% of Your ROI?
Campaigns for demand generation—like YouTube, Instagram, and Facebook video ads—get cut all the time. Not because they don’t work, but…
Reading Time: 5 min
Why Startups with Long Sales Cycles Can't Afford to Ignore Enhanced Conversions
Excerpt: Struggling to prove what’s working in your Google Ads account? If your startup has a long sales cycle, skipping…
Reading Time: 4 min